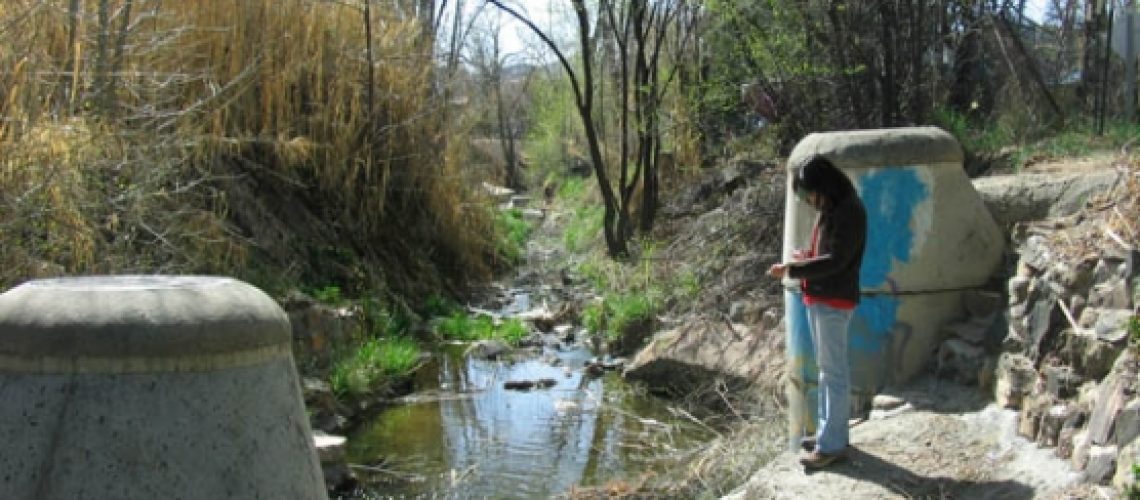
It seems like I have spent most of the summer and fall swimming in data. It is a relief to get to a point when the hard work starts to pays off and the data starts to speak…or maybe that means that I’ve been looking at data for too long! Most recently, we’ve been getting acquainted with the data collected thru the watershed field survey, a “boots on the ground” piece of the Upper Granite Creek Watershed Improvement Planning project.
Local Creek Crew volunteers walked nearly 17 miles of local creeks to document sources and causes of excessive nutrients (nitrogen and phosphorus) and Escherichia coli (E. coli) bacteria in Granite Creek and its tributaries. Volunteers walked assigned quarter-mile segments from March 27 to July 28, 2010, with nearly 3/4 of the stream segments visited on March 27th during a full day training and field event. It was a great event! See photos of the Creek Crew in action here.
We focused on the urban and developed stream reaches. Below is a breakdown of the miles of walked along the following local creeks:
Creek Miles
Aspen Creek 2.75
Banning Creek 1.5
Butte Creek 2.75
Granite Creek 2.5
Manzanita Creek 2.25
Miller Creek 3
North Fork Granite 1.75
Volunteers collected information in the following pollutant ‘source’ categories:
- Stormwater drainage
- Sewer infrastructure
- Animal corrals
- Pet wastes
- Trash
- Fire damage
- Tributary drainage
- Fertilizer user
- Human waste (lack of toilet facilities/exposed fecal material)
- Wildlife
- Impaired buffer
- Structures – buildings, walls, roads, bridges, patios, sewer manholes
- Activities – hiking paths, grazing, lawns or gardens, crops
307 impact “sites” were documented in the field survey. Each site may have had one or more type of impact or potential pollution source. The most common impacts or sources of nutrients and fecal bacteria in our watershed appear to be stormwater drainage (146 sites), impaired buffers (306 sites), sewer infrastructure (79 sites), and fertilized lawns and gardens (54 sites). Trash and domestic animals may also play a part, but neither were heavily documented thru this survey.
The creeks with the highest density of impacts (# of impact sites/miles assessed) are Miller Creek, Granite Creek, and Aspen Creek.
This data, inconjunction with water quality data collected by Creek Crew volunteers and the riparian buffer assessment data, is helping us to narrow in on the ‘what’ and ‘where’ of nonpoint source pollution in our watershed. The next step….finding solutions, which you can be a part of, too!
Stay tuned for a full report on the field survey findings. It will be posted here.

